Digital Marketing, Web Design
Google Analytics 101 for the Small Business Owner
August 12, 2014


What it is and how to use it.
If you have an online presence, chances are you use Google Analytics (or at least have heard of it). You might even already have an account, but have you ever logged in and really dug in? Once you get past your home screen, your world is opened to a vast source of reports, graphs, visit counts and other measureable statistics that can be extremely helpful in determining the success (or missteps) of your website but might be daunting. Take a look at a few tips that can take you from glazed-over to Google guru!
Compare & Contrast
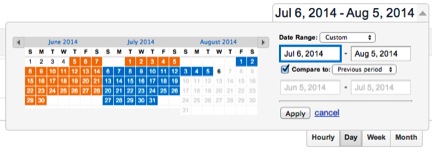
Using your calendar tool, check the box under “Date Range” to compare 2 date ranges. Be mindful of dates that are selected and their corresponding days of the week. For example: August 2, a Saturday, may have extremely different results than July 2, a Wednesday because consumer behaviors and online times differ on these days.
Use this tool compare traffic behavior during special promotions with finite date ranges like advertisements, email marketing, and social media campaigns.
To get “bigger picture” data, we suggest using slightly less micro-level data like a month at a time.
Go Mobile
We’re big advocates for mobile-friendly and responsive websites, but you may still be on the fence. Visit your Audience > Mobile Overview section to compare your traffic between desktop, mobile and tablet views. If at least 10% of your traffic per month is visiting on a mobile device, that’s a pretty good piece of the pie. Our clients’ websites typically receive 25%-48% of traffic from mobile devices. It’s best to make sure they’re getting the full experience!
Customize It
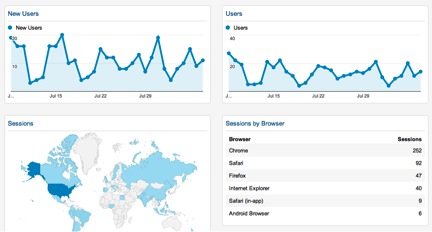
There may be certain metrics that aren’t of interest to you or don’t currently apply to your business model. Make your Analytics dashboard a one-stop-shop to make monitoring your site convenient and simple. Click Dashboard > +New Dashboard to build a custom interface that only uses the modules that are most relevant to you. If you’re unsure of where to start, Google will even provide a Starter Dashboard (pictured above). You can even filter out your own IP address if you suspect a lot of your traffic comes from your own employees.
Learn the Lingo
Visits, page views, channels…it can be difficult to distinguish what matters most to your site performance if you don’t know the actual meaning of the words being used. We’ve found a few great resources for beginners who are just learning the ropes:
- Glossary: http://www.epower.com/google-analytics-glossary.php
- Help: https://support.google.com/analytics/?hl=en#topic=3544906
- Reporting: http://blog.hubspot.com/marketing/create-google-analytics-custom-report-ht
- Analytics Academy, a free training resource from Google: https://analyticsacademy.withgoogle.com/explorer
There are a couple of questions that we receive quite often when it comes to website analytics. We’ll go ahead and answer those in case you’re wondering too:
- What is Bounce Rate, and what is average? Bounce rate is the percentage of single page sessions. This means that someone entered your site and exited without interacting with any links on your site. This can stem from several factors – your website could be experiencing usability issues, or on the contrary, the user could have found the information they were looking for and exited the site thereafter.Generally, a bounce rate between 26-40% is excellent with 41-55% being average. If you’re showing a less-than-desirable bounce rate, try changing your game up a little by updating your website design or optimizing landing pages so the content is more relevant to users who are searching for your site. We recently ran across this article which gives some great advice on increasing your bounce rate.
- What is the difference between sessions and visitors? Google has recently updated the term “visits” to “sessions” and “visitors” to users. Think of a session as the group of actions that occur on your website with one user within a given amount of time. For example, a user may come to your website, browse a few pages, then submit their information through your contact form (usually about 30 minutes). Later that evening, they hop back on to grab your phone number from your contact page (or any information). This one user has conducted two sessions on your website. Get it?
This can also clear up the haziness between sessions and pages. Within a span of 30 minutes, one user can visit multiple pages on your website, and this is all included in his/her session. There is related metric for this, Pages/Session, which will display the average number of pages visited per session on your website.
Set (and Achieve!) Goals
Within Google Analytics, goals are a way you can measure how well your site or app is completing objectives. You can integrate your site to measure click through rates from Google Ads, measure form completions as goals and measure e-commerce sales.
At Yellow Duck, we’re nerds for statistics and numbers, so if SEO and analytics aren’t your cup of tea, give us a call and let us do the data work (instead of dirty work, get it?), plus we have an amazing search engine optimization consultant ready to boost your site.
Do you have any tricks you’ve learned through experience with Google Analytics? We’d love to hear them!